

Gotta account for a null hypothesis.
The null would be that it is a fair die (average roll 10.5). Your test is whether the true result is significantly less than 10.5 based on a sample of 100 with a mu of 8.8. Let’s call it an alpha of 0.05
So we have to run a left tail one-sample t-test.
Unfortunately, this data set doesn’t tell me the standard deviation – but that could be determined in future trials. For now, we’ll have to just make an assumption that the D20 is fair. For a fair D20, the standard deviation should be be
sqrt( ([20-1+1]^2 -1)/12)or roughly sqrt(33.25)We can run that t-test in a simply python script:
import numpy as np
from scipy import stats as st

h0 = 10.5

sample = np.random.normal(loc=8.88, scale=(np.sqrt(33.25)), size=100)

t_stat, p_val = st.ttest_1samp(sample, h0)

print(f"T-statistic: {t_stat:.4f}")
print(f"P-value: {p_val:.4f}")
Of course, I had to randomize this a bit since I don’t have access to the full data from the true sample. That would make for a better bit of analysis. But at least assuming I didn’t make a serious dumb here, 100 rolls averaging 8.88 would seem to suggest that the you can reject your null hypothesis of this being a fair die at a typical alpha of 0.05.
Then again, the way I wrote this script is GUARANTEED to be an unfavorable result since the way I randomized it REQUIRES the average end up 8.88, which is, of course, less than 10.5. Your real world testing would not have this constraint.
I know some of these words
Mind giving an ELI5 version?
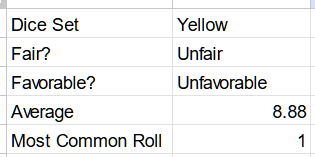
Here's the data for 100 rolls with the yellow die if it helps.
I copied it right out of the spreadsheet so I’m pretty sure it’s formatting is borked.
4 4 15 5 11 15 9 20 7 19 5 12 17 6 18 5 3 2 19 14 5 8 9 1 7 7 2 7 7 2 19 13 11 7 5 3 5 9 15 14 5 3 12 1 9 1 20 19 13 1 1 3 6 2 3 8 13 15 4 4 1 16 2 5 1 12 12 1 5 3 14 11 13 6 8 7 11 19 6 13 20 3 12 15 4 4 4 10 20 1 7 1 16 9 14 10 16 12 20 15
Basically he is giving you info on how to interpret the result you got. A t-test (Student’s t-test) gives a “p-value” which sometimes comes up in some articles regarding a statistical result. It is a way of assessing whether the result you got is different enough from the expected value (a fair die) taking into account that you can’t throw the dice an infinite amount of times. Generally a p-value less than 0.05 is considered statistically significant* and you can trust your result.
You can do the calculation here too if you want to get some values about it and more info.
*) Sort of means that there is only a 5% probability that your result is due to randomness.
This assumed you only tested one die.
If OP tested a thousand dice, and this is the one that came out on the bottom, then it’s incredibly likely it’s just random because of how many dice were tested.
MULTIPLE COMPARISON CHANGES THE RULES OF STATISTICAL HYPOTHESIS TESTING, and the OP is giving us a single result from multiple comparisons which are censored.
Probably an innocent mistake, but not valid.
How many dice did you test, and can we see the rest of the spreadsheet?
100 rolls is a staggeringly small sample size for a set with 20 possible outcomes, I would take this with a grain of salt (or a lot of salt in a glass of water? ;) )
In any case it’s fun to do some experimenting like this, thanks for sharing!
I guess you could say the 100 rolls per die was for an initial test to see if anything statistically abnormal may be happening.
I’m going to up the tests to 250 for the 3 most and least favorable dice to see if they really are super favorable or unfavorable.
Seems like a good next step! Looking forward to seeing further updates!
So far 2 dice in and the new results are looking very interesting
It’s going to be probably a couple days for the new results but I’ll make a more detailed post for sure including the amount of times each number came up on each die
This is good work.
I tested 17 D20’s today and the spread was definitely interesting
I had 3 that had averages over 11 and only 2 under 10
3 of them had the most common roll being a 1 and 1 had 2.
Funnily enough the 1 with 2 as the most common result had an average result of 10.73. So it was still favorable to the dice roller as it beat 10.5.
Neat. What was your sample size?
100 per D20
Wouldn’t that be 100?
The title?
Dammit. Reading is hard. Thanks lol
You need to include N rolls in your summary
Edit: nvm it’s in the title
IMO unfavourable dice are much more fun
Different strokes for different folks really
Personally I like playing characters with crappy stats over unfavorable dice
One of my favorite DnD characters I ever played had only 2 stats over 10; a 12 and an 11.
